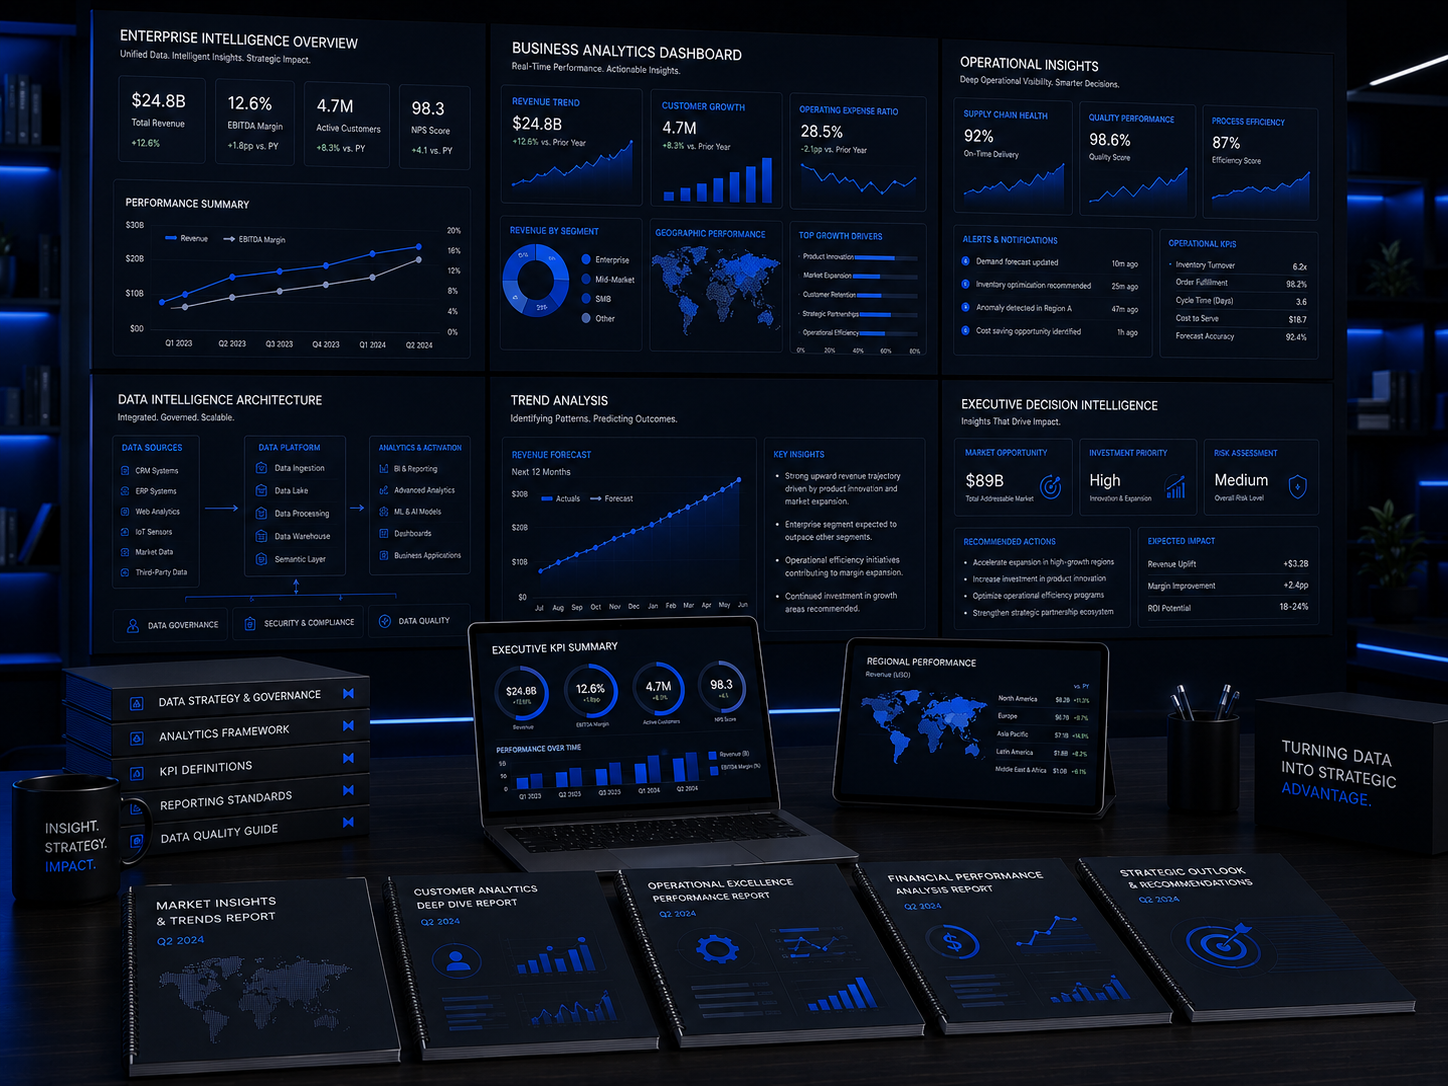
• Web Development
  • Mobile Apps
  • Branding
  • SEO
  • UI/UX
  • Consulting
  • Policies
  • Support
  • About Us
  • Our Work
Web Development
  • Overview
  • E-commerce Shop
  • Education LMS
  • Freelance Platform
  • Job Board
  • Healthcare Platforms
  • Bookings & Rentals
  • Cryptocurrencies
  • Logistics & Shipping

Structured analysis that turns your raw business data into actionable insights

Data Analysis transforms your spreadsheets, databases, and reports into clear, actionable insights that drive better business decisions. Whether you need to understand customer behavior, evaluate financial performance, assess operational efficiency, or prepare data for investor presentations, we structure the analysis so you see the patterns, understand the implications, and know what to do next.

The Problem

You Are Sitting on Valuable Data and Extracting Almost Nothing From It

Your business generates data every day. Sales figures. Customer records. Operational metrics. Financial transactions. But that data sits in spreadsheets nobody analyzes, in reports nobody reads, and in systems nobody connects. You sense there are insights buried in there. Patterns that could reveal cost savings. Trends that could predict customer behavior. Metrics that could strengthen your investor case. But raw data is not insight. Raw data is noise. Structured analysis turns the noise into signal so you can see what your business is actually telling you.

Pain Points

01

Your Data Is Scattered Across Disconnected Sources

Sales data lives in one system. Customer information in another. Financial records in spreadsheets. These sources do not talk to each other, so you cannot see the relationships that matter. The full picture of your business remains invisible.

02

You Cannot See the Trends That Matter

Monthly numbers arrive, but nobody is tracking how they change over time, how they compare to targets, or what they predict about the future. You are reacting to individual data points instead of understanding the trajectory.

03

Investors and Partners Want Numbers You Cannot Provide

When asked about customer acquisition cost, lifetime value, churn rate, or unit economics, you either do not have the answer or cannot show the analysis that produced it. This undermines confidence in your business management.

04

You Make Decisions Based on Intuition Because Data Feels Inaccessible

The information exists somewhere, but extracting it feels like a project you do not have time for. So you rely on experience and gut feel even when the data could give you a clearer answer.

Our Solution

Your Business Data Structured, Analyzed, and Presented as Clear Actionable Insights

Data Analysis takes your raw business information and transforms it into structured analysis you can actually use. We clean and organize your data, identify the patterns and trends that matter, calculate the metrics investors and managers need, and present everything in clear reports and visualizations that make the insights immediately understandable and actionable.

Before data analysis showing scattered raw data with no insights
Before

Scattered, Unanalyzed, and Providing No Guidance

  • Data disconnected across multiple sources
  • No trend tracking or performance visibility
  • Key metrics unknown or uncalculated
  • Decisions based on intuition, not evidence
After data analysis showing clear structured insights and visualizations
After

Structured, Insightful, and Driving Confident Decisions

  • Data consolidated and organized for analysis
  • Trends tracked and projections modeled
  • All key metrics calculated and documented
  • Every major decision supported by evidence

Consolidated Data

Information from multiple sources brought together into a single structured view of your business.

Visible Trends

Patterns and trajectories surfaced so you can anticipate changes instead of just reacting to them.

Calculated Metrics

Every KPI that matters for your business model calculated, documented, and ready for stakeholders.

Decision Confidence

Make strategic choices backed by structured evidence instead of relying on gut feel alone.

Deliverables

What You Actually Get

Complete data analysis with consolidated datasets, calculated metrics, trend visualizations, and clear interpretive reports your team and stakeholders can use immediately.

01

Data Consolidation & Cleaning

Your scattered data gathered, cleaned, and organized into one reliable structured dataset.

02

Key Metrics Calculation

Every important KPI calculated with clear methodology so you know exactly what the numbers mean.

03

Trend & Pattern Analysis

The patterns in your data surfaced and explained so you can act on them, not just observe them.

04

Data Visualization Package

Your data presented visually so insights are immediate and presentations are compelling.

05

Financial Performance Analysis

What is driving your revenue and costs, and where the biggest opportunities for improvement sit.

06

Customer Behavior Analysis

How your customers behave, what they are worth, and where you should focus to grow.

07

Operational Efficiency Analysis

Where your operations are efficient, where they are not, and what to fix first.

08

Analysis Report & Executive Summary

Everything documented and summarized in formats ready for your team, board, or investors.

Our Approach

Data Analysis Process

A structured analytical methodology that moves from raw data to clear insights, ensuring every finding is traceable, defensible, and actionable.

Phase 1, Requirements & Data Inventory

1 / 6

We define the business questions the analysis must answer and map the data sources available to answer them.

Business Question Definition

Clarifying exactly what decisions the analysis must inform and what questions it needs to answer definitively.

Data Source Identification

Mapping all available data sources including spreadsheets, databases, CRM systems, financial records, and operational tools.

KPI & Metric Specification

Defining the specific metrics and calculations required with clear formulas and data requirements for each.

Analysis Plan & Timeline

Establishing the analytical methodology, data access schedule, and milestone delivery dates for the engagement.

Key Milestones

  • Business questions defined
  • Data sources mapped
  • KPIs specified
  • Analysis plan confirmed

Phase 2, Data Collection & Preparation

2 / 6

We gather data from all identified sources, clean inconsistencies, and prepare a structured dataset ready for rigorous analysis.

Data Extraction & Gathering

Collecting data from spreadsheets, database exports, system reports, and any other sources identified during scoping.

Data Cleaning & Validation

Identifying and correcting errors, removing duplicates, standardizing formats, and handling missing values systematically.

Data Integration & Merging

Combining data from multiple sources into a unified dataset with consistent keys and relationships for cross-source analysis.

Data Quality Verification

Confirming the cleaned dataset is complete, accurate, and ready for analysis with documented quality checks and known limitations.

Key Milestones

  • All data extracted
  • Data cleaned and validated
  • Sources integrated
  • Quality verified

Phase 3, Exploratory Analysis & Metrics

3 / 6

We calculate all specified metrics and conduct exploratory analysis to surface initial patterns, trends, and areas requiring deeper investigation.

KPI Calculation

Computing all specified metrics with documented formulas, assumptions, and data sources for every calculation.

Descriptive Statistics

Generating summary statistics, distributions, and overview metrics that describe the shape and characteristics of your data.

Initial Pattern Identification

Surfacing trends, correlations, outliers, and patterns that warrant deeper investigation in the next phase.

Focus Area Prioritization

Identifying the most significant findings and areas where deeper analysis will deliver the greatest business value.

Key Milestones

  • All KPIs calculated
  • Descriptive statistics generated
  • Initial patterns identified
  • Deep-dive priorities set

Phase 4, Deep-Dive Analysis

4 / 6

We investigate the priority areas in depth to uncover root causes, quantify relationships, and generate the insights that drive decisions.

Trend & Time Series Analysis

Analyzing how metrics change over time, identifying growth trajectories, seasonality, and inflection points in your data.

Root Cause Investigation

Drilling into significant variances and anomalies to understand what caused them and what they imply for the business.

Segmentation Analysis

Breaking down data by customer segment, product line, geography, or time period to reveal performance differences across groups.

Relationship & Correlation Analysis

Identifying connections between variables to understand what drives your key business outcomes.

Key Milestones

  • Trend analysis completed
  • Root causes identified
  • Segments analyzed
  • Key relationships documented

Phase 5, Visualization & Storytelling

5 / 6

We translate analytical findings into clear visualizations and a coherent narrative that makes the insights accessible to any audience.

Data Visualization Creation

Designing charts, graphs, and dashboards that present key findings clearly and make complex data immediately understandable.

Insight Narrative Development

Structuring the analytical findings into a clear logical story that connects data to decisions and makes the implications obvious.

Actionable Recommendation Formulation

Translating insights into specific recommended actions with clear rationale linking each recommendation to the analytical evidence.

Report Compilation

Assembling the complete analysis report with methodology, findings, visualizations, and recommendations in a structured document.

Key Milestones

  • Visualizations created
  • Insight narrative structured
  • Recommendations formulated
  • Report compiled

Phase 6, Report & Stakeholder Presentation

6 / 6

We deliver the complete analysis and present findings to your team and stakeholders with clear explanations and Q&A support.

Comprehensive Analysis Report

Complete documented analysis with all findings, methodology, data sources, visualizations, and recommendations.

Executive Presentation Deck

Presentation-ready summary of key insights and recommendations formatted for leadership and investor audiences.

Findings Presentation Session

Live presentation of analysis results to your team or stakeholders with detailed explanation and Q&A discussion.

Complete Data & Analysis Handover

All cleaned datasets, analysis files, calculations, and documentation delivered in organized formats for ongoing use.

Key Milestones

  • Analysis report delivered
  • Executive presentation created
  • Findings presented
  • Data and analysis handed over

Featured Projects

Workdone: A unified brand and digital foundation for a multi-subsidiary Pan-African financial group building institutional credibility across emerging African markets.

Workdone: A complete brand and business foundation preparing a cleaning startup for market entry and investment readiness.

Frequently Asked Questions

No questions found

Try adjusting your search term.

Ready to Understand Your Data?

Stop Collecting Data and Start Using It to Drive Your Business Forward

Your business generates valuable data every single day. Stop letting it sit unused in spreadsheets and system reports. Turn those numbers into the insights that drive better pricing, smarter operations, stronger investor confidence, and faster growth.

Data analysis insights with charts metrics and business intelligence dashboard preview
Logo